Credits & Data Sources
Play Deep Time Earth is built on the following open datasets and tools.
Data Sources
Cao et al. (2024), Earth's tectonic and plate boundary evolution over 1.8 billion years, model version 2.4
CC BY 4.0Continental crust fragments and plate boundaries at 540–1800 Ma. Not elevations, climate or actual palaeocoastlines.
Cao et al. (2024), Earth's tectonic and plate boundary evolution over 1.8 billion years, model version 2.4
Source ↗Related study ↗Modifications: Reconstructed using the model's palaeomagnetic frame and valid source ages. A fixed +60° eastward display rotation aids continuity without changing source data. Latitudes and poles are preserved; display longitudes differ from the model's. Plate boundaries use 5 Ma intervals; interpolation does not improve scientific accuracy. Continental configuration and shape differences remain at 540 Ma.
⚠ The dataset is CC BY 4.0, distinct from the paper's CC BY-NC-ND license. Paper figures and supplemental videos are not redistributed.
PaleoMIST 1.0
CC BY 4.0A global ice-sheet and paleotopography model for the past 80,000 years. Source steps are 2,500 years apart and include Earth deformation and spatially varying sea-level change.
Gowan, E.J. (2019). Global ice sheet reconstruction for the past 80000 years. PANGAEA, DOI 10.1594/PANGAEA.905800. Study: Gowan et al. (2021), A new global ice sheet reconstruction for the past 80,000 years, Nature Communications 12, 1199, DOI 10.1038/s41467-021-21469-w.
Source ↗Related study ↗Modifications: Terrain and reconstructed ice-sheet margins from scenario a1 (Hudson Bay remains ice-covered through MIS 3) adapted for display. The nearest source step, spaced 2,500 years apart, is shown; the modern comparison uses the same model baseline. Derived data: CC BY 4.0. Smoother edges do not improve observational accuracy. The display can omit small islands and narrow straits and does not establish human movement or passability. Ice shows reconstructed extent, not sea ice or a definitive grounding map. 0 ka refers to 1950 CE. Not applied before 80,000 years ago; no warranty or author endorsement is implied.
Underlying model sources
Underlying sources credited by the model. The service uses PaleoMIST; the originals, papers and figures below are not separately redistributed.
- Schaffer, J. & Timmermann, R. (2016). Greenland and Antarctic ice sheet topography, cavity geometry, and global bathymetry (RTopo-2). · CC BY 3.0
- IceBridge MCoRDS L2 Ice Thickness, v1, DOI 10.5067/GDQ0CUCVTE2Q. Paden et al. (2010); cited as Leuschen et al., updated 2017, in the PaleoMIST README. Agassiz and Barnes Ice Cap corrections.
- Dowdeswell, J.A. et al. (2004). Form and flow of the Devon Island Ice Cap, Canadian Arctic. DOI 10.1029/2003JF000095. Devon Ice Cap correction.
- Hughes, A.L.C. et al. (2015/2016). DATED-1: Eurasian ice-sheet extent chronology. Dataset DOI 10.1594/PANGAEA.848117; study DOI 10.1111/bor.12142. · CC BY 3.0
- GLIMS Consortium et al. (2005). GLIMS Glacier Database, NSIDC-0272. DOI 10.7265/N5V98602; Raup et al. (2007), DOI 10.1016/j.gloplacha.2006.07.018.
- Fretwell, P. et al. (2013). Bedmap2: improved ice bed, surface and thickness datasets for Antarctica. DOI 10.5194/tc-7-375-2013. The linked BAS archive records the dataset under CC BY 4.0. · CC BY 4.0
- RAISED Consortium / Bentley, M.J. et al. (2014). A community-based geological reconstruction of Antarctic Ice Sheet deglaciation since the Last Glacial Maximum. DOI 10.1016/j.quascirev.2014.06.025. Cited study; separate GIS originals are not redistributed.
- Ehlers, J., Gibbard, P.L. & Hughes, P.D. (eds., 2011). Quaternary Glaciations—Extent and Chronology: A Closer Look. Patagonia reconstruction source cited by PaleoMIST.
PaleoDEM
CC BY 4.0Paleodigital Elevation Models (0–540 Ma heightmaps)
Scotese, C.R. and Wright, N.M. (2018). PALEOMAP Paleodigital Elevation Models (PaleoDEMS) for the Phanerozoic.
Modifications: Terrain adapted for visualization with narrow-strait corrections. Modern coastline data is applied only at 0 Ma.
PaleoMAP PaleoCoastlines data v7.3
CC BY 4.081 global coastline reconstructions (0–535 Ma). PaleoDEM coastlines adjusted using fossil records to represent maximum marine flooding.
Kocsis, A.T. and Scotese, C.R. (2023). PaleoMAP PaleoCoastlines data, v7.3. Zenodo. Study: Mapping paleocoastlines and continental flooding during the Phanerozoic, Earth-Science Reviews, DOI 10.1016/j.earscirev.2020.103463.
Source ↗Related study ↗Modifications: Coastlines and inland waters at 5–535 Ma adapted for display, with interpolation between source ages. 0 Ma uses modern Natural Earth coastlines and existing inland water; 540 Ma uses terrain-based water. Derived water data is also CC BY 4.0. Water: these representative reconstructions show maximum marine flooding, not lake or coastline boundaries at an exact selected instant. Changes between source ages are visual estimates and do not establish when a basin became isolated or reconnected.
Natural Earth
Public DomainOcean / marine polygons for shallow-sea correction at 0Ma (modern coastline)
Natural Earth — naturalearthdata.com
Modifications: Used to correct the display of modern coastlines and shallow seas.
CESM paleoclimate simulation
CC BY 4.0Modeled surface temperature, precipitation and wind at 0–540 Ma
Li, X. et al. (2022). A high-resolution climate simulation dataset for the past 540 million years. Scientific Data, 9, 371.
DOI: 10.1038/s41597-022-01490-4
Modifications: Annual surface temperature from CESM (T): a model estimate, not a direct observation of the past. Adapted for visualization, with interpolation between source ages 10 Ma apart. Global surface temperature is an area-weighted annual mean. 0 Ma is pre-industrial; Köppen is an approximate classification based on annual means.
PBDB
CC0 1.0Paleobiology Database (fossil occurrence records)
Peters, S.E. and McClennen, M. (2016). The Paleobiology Database application programming interface. Paleobiology, 42(1), 1-7.
Modifications: Up to 10,000 records sampled per 5 Ma window (0 Ma: 0–2.5 Ma), with supported ancient locations reconstructed. Sampling varies by age, region and taxon; counts are not abundance or biodiversity. Original references are available through PBDB.
GPlates / PyGPlates
GPL v2 (software; model data licensed separately)Tools for plate-tectonic and ancient-location reconstruction
Müller, R.D. et al. (2018). GPlates: Building a Virtual Earth Through Deep Time. G-cubed, 19.
DOI: 10.1029/2018GC007584
Modifications: Used to reconstruct ancient positions from the models.
SETON2012 rotation model
CC BY 4.00–200 Ma plate boundaries (separate model comparison)
Seton, M. et al. (2012). Global continental and ocean basin reconstructions since 200 Ma. Earth-Science Reviews, 113.
Modifications: Plate boundaries reconstructed at 5 Ma intervals and simplified for display.
PALEOMAP PaleoAtlas (rotation model)
CC BY 4.00–540 Ma coordinate reconstruction (Scotese 2016 reference frame; per-point validity checked)
Scotese, C.R. (2016). PALEOMAP PaleoAtlas for GPlates, v3. Zenodo.
Modifications: Ancient locations reconstructed for fossils, cities and geological events, within the model's supported locations and ages.
Müller 2022 rotation model
CC BY 4.0200–540 Ma plate boundary reconstruction
Müller, R.D. et al. (2022). A tectonic-rules-based mantle reference frame since 1 billion years ago – implications for supercontinent cycles and plate–mantle system evolution. Solid Earth, 13, 1127–1159. Model v1.2.4.
Modifications: Plate boundaries reconstructed at 5 Ma intervals and simplified for display.
PhyloPic
Per-image CC0 / CC BYTaxon silhouettes in fossil details and creature cards
PhyloPic — phylopic.org
Modifications: Resized for display. Each image includes its original attribution and artwork/license links.
ICS geological timescale 2026/06
CC BY 4.0Single source for geological boundaries and period names
International Commission on Stratigraphy, International Chronostratigraphic Chart, 2026/06.
Source ↗Modifications: Geological boundaries adapted for the service with translated names and service-selected display colors.
CenCO₂PIP v1.02
CC BY 4.01 Ma summaries of Cenozoic CO₂ proxy records
CenCO2PIP Consortium (2023), Science 382, eadi5177; vetted data v1.02 (2024).
Modifications: Eligible category 1/2 records; median of study medians. Ranges describe samples, not confidence intervals. Empty bins remain unavailable.
Miller 2020 sea level
CC BY 4.0Sea-level reconstruction, 0.98–64.82 Ma
Miller, K.G. et al. (2020). Smoothed Cenozoic sea-level relative to modern from deep-sea geochemical and continental margin records [dataset]. PANGAEA.
Modifications: Linear interpolation of supplied smoothed series; no extrapolation. 0 Ma is a present-day 0 m reference.
Macrostrat
CC BY 4.0Present-day map geology at 25 city centers
Macrostrat; Peters et al. (2018). Original map references retained and displayed for each city.
Source ↗Modifications: Selected geology information displayed for each city, retaining original unit names and ages. Not a paleomap or site survey.
Plate boundaries are a separate model comparison. Their reference frame differs from PALEOMAP terrain and coordinates; coastlines may not align.
A flow illustration derived from wind and sea temperature. It is not an ocean circulation simulation; particle speed is not a physical velocity.
Wind: CESM annual mean U/V, 1000 hPa. Atmospheric rim glow is decorative.
Human origins, movement and encounters — research
Event dates, places, evidence and uncertainties are independently summarized from the linked primary studies. Paper text, figures and genetic sequences are not redistributed. Each paper and its associated data retain their own rights.
Literature reviewed: 2026-09-25
- New fossils from Jebel Irhoud, Morocco and the pan-African origin of Homo sapiensHublin et al. · 2017-06-07 · DOI: 10.1038/nature22336
- A weakly structured stem for human origins in AfricaRagsdale et al. · 2023-05-17 · DOI: 10.1038/s41586-023-06055-y
- Pleistocene chronology and history of hominins and fauna at Denisova CaveJacobs et al. · 2025-05-21 · DOI: 10.1038/s41467-025-60140-6
- Denisovan mitochondrial DNA from dental calculus of the >146,000-year-old Harbin craniumFu et al. · 2025-06-18 · DOI: 10.1016/j.cell.2025.05.040
- The proteome of the late Middle Pleistocene Harbin individualFu et al. · 2025-06-18 · DOI: 10.1126/science.adu9677
- Ancient proteins identify various Denisovan remains from Southwest ChinaRao et al. · 2026-09-09 · DOI: 10.1038/s41586-026-10976-9
- Denisovans from southwestern China and their subsistence strategiesRuan et al. · 2026-09-09 · DOI: 10.1038/s41586-026-10997-4
- The genome of the offspring of a Neanderthal mother and a Denisovan fatherSlon et al. · 2018-08-22 · DOI: 10.1038/s41586-018-0455-x
- Major expansion in the human niche preceded out of Africa dispersalHallett et al. · 2025-06-18 · DOI: 10.1038/s41586-025-09154-0
- Neanderthal ancestry through time: Insights from genomes of ancient and present-day humansIasi et al. · 2024-12-12 · DOI: 10.1126/science.adq3010
- Earliest modern human genomes constrain timing of Neanderthal admixtureSümer et al. · 2024-12-12 · DOI: 10.1038/s41586-024-08420-x
- Genomic evidence supports the “long chronology” for the peopling of SahulGandini et al. · 2025-11-28 · DOI: 10.1126/sciadv.ady9493
- Middle and Late Pleistocene Denisovan subsistence at Baishiya Karst CaveXia et al. · 2024-07-03 · DOI: 10.1038/s41586-024-07612-9
- Genetic diversity of late Neanderthals in northwestern EuropeBossoms Mesa et al. · 2026-06-24 · DOI: 10.1038/s41586-026-10625-1
- The evolutionary history and unique genetic diversity of Indigenous AmericansAraújo Castro e Silva et al. · 2026-04-22 · DOI: 10.1038/s41586-026-10406-w
- A male Denisovan mandible from Pleistocene TaiwanTsutaya et al. · 2025-04-10 · DOI: 10.1126/science.ads3888
- The Persian plateau served as hub for Homo sapiens after the main out of Africa dispersalVallini et al. · 2024-03-25 · DOI: 10.1038/s41467-024-46161-7
- Homo sapiens reached the higher latitudes of Europe by 45,000 years agoMylopotamitaki et al. · 2024-01-31 · DOI: 10.1038/s41586-023-06923-7
- 40,000-Year-Old Individual from Asia Provides Insight into Early Population Structure in EurasiaYang et al. · 2017-10-12 · DOI: 10.1016/j.cub.2017.09.030
- The population history of northeastern Siberia since the PleistoceneSikora et al. · 2019-06-05 · DOI: 10.1038/s41586-019-1279-z
- Terminal Pleistocene Alaskan genome reveals first founding population of Native AmericansMoreno-Mayar et al. · 2018-01-03 · DOI: 10.1038/nature25173
- Early human dispersals within the AmericasMoreno-Mayar et al. · 2018-11-08 · DOI: 10.1126/science.aav2621
- Independent age estimates resolve the controversy of ancient human footprints at White SandsPigati et al. · 2023-10-05 · DOI: 10.1126/science.adh5007
- Nuclear DNA sequences from the Middle Pleistocene Sima de los Huesos homininsMeyer et al. · 2016-03-14 · DOI: 10.1038/nature17405
- Neanderthals in central Asia and SiberiaKrause et al. · 2007-09-30 · DOI: 10.1038/nature06193
- Genetic insights into the social organization of NeanderthalsSkov et al. · 2022-10-19 · DOI: 10.1038/s41586-022-05283-y
Museum specimens
Photographs of separate museum specimens. These are not asserted to be the same specimens as mapped PBDB occurrences. Names and ages retain museum catalog wording.
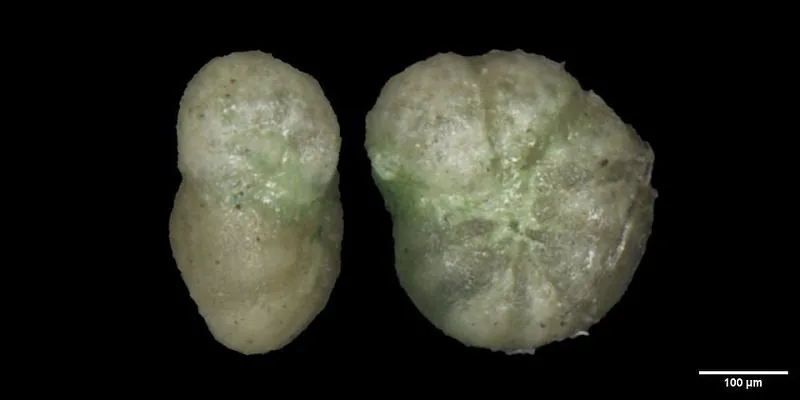
Anomalina beccariiformis (White, 1928)
CC46806 · Mesozoic / Cretaceous / Late
Smithsonian Institution, National Museum of Natural History
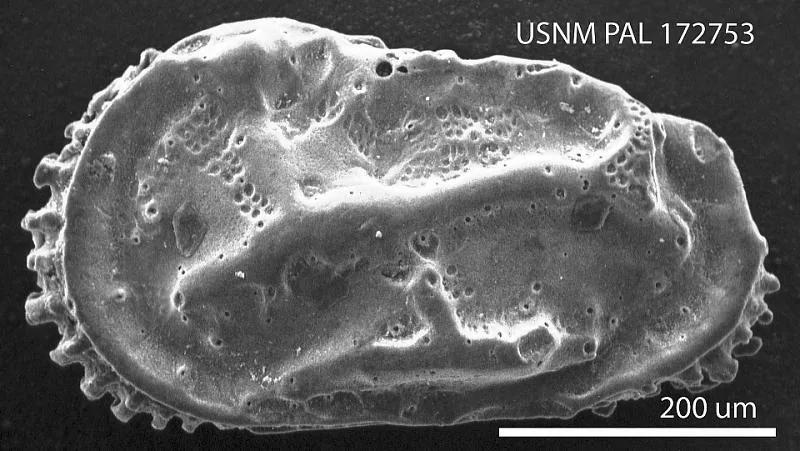
Neocaudites triplistriatus (Edwards, 1944)
PAL172753 · Cenozoic / Neogene / Miocene
Smithsonian Institution, National Museum of Natural History
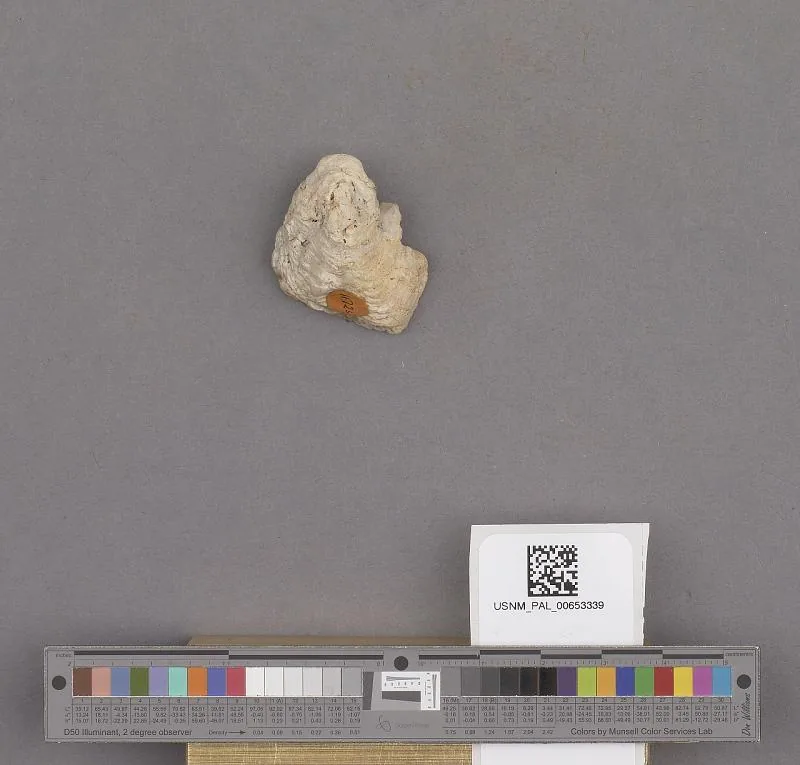
Bivalvia
PAL653339 · Cenozoic / Quaternary / Pleistocene
Smithsonian Institution, National Museum of Natural History
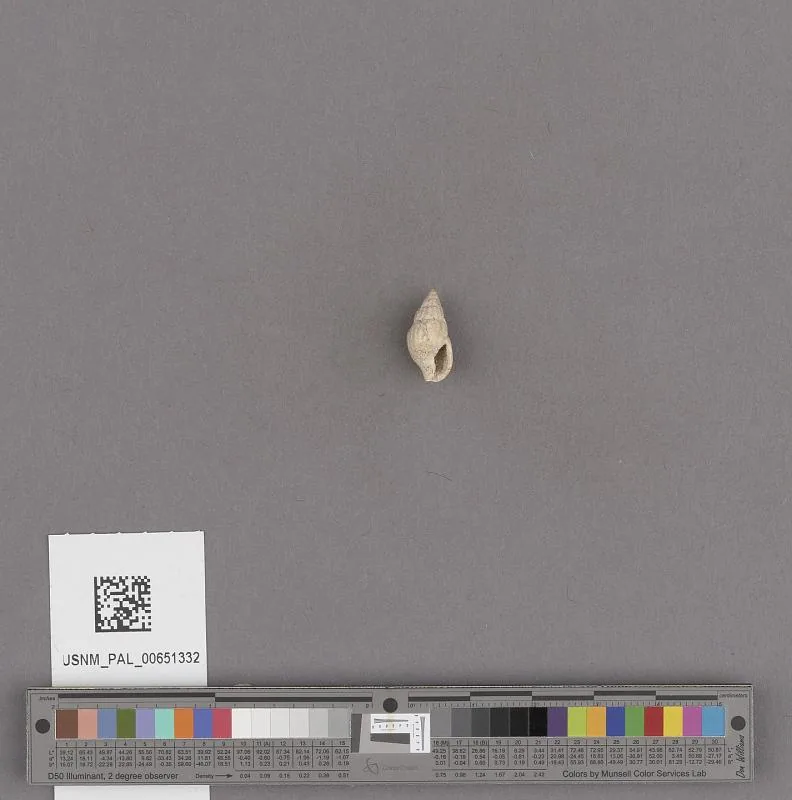
Amphissa reticulata Dall
PAL651332 · Cenozoic
Smithsonian Institution, National Museum of Natural History
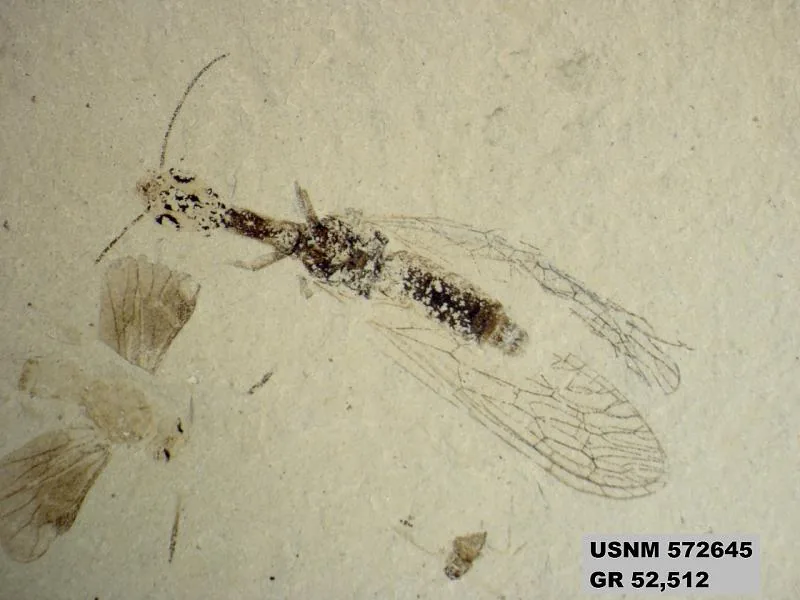
Genus sp
PAL572645b · Cenozoic / Paleogene / Eocene
Smithsonian Institution, National Museum of Natural History
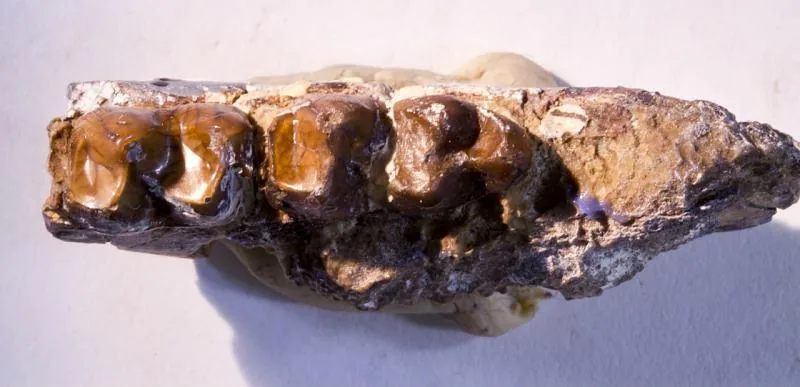
Hyracotherium tapirinum (Cope)
V1076 · Cenozoic / Paleogene / Eocene / Wasatchian
Smithsonian Institution, National Museum of Natural History
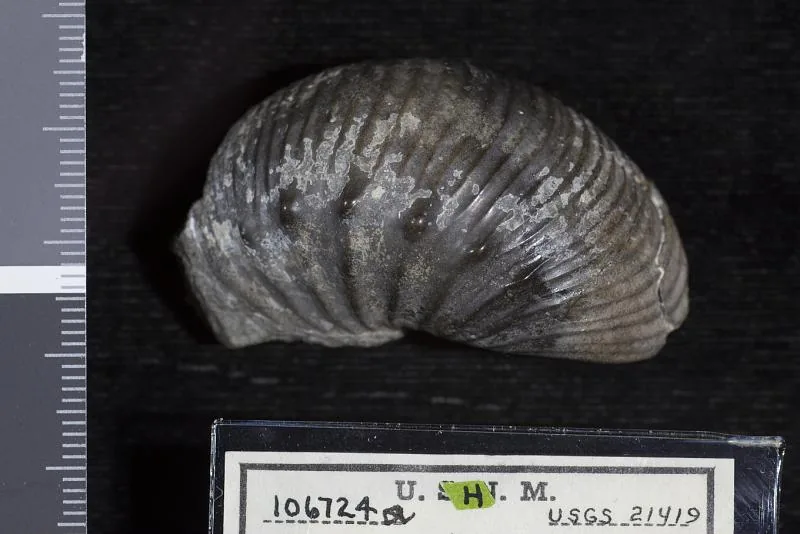
Desmoscaphites erdmanni Cobban
PAL106724 · Age not supplied by the museum
Smithsonian Institution, National Museum of Natural History
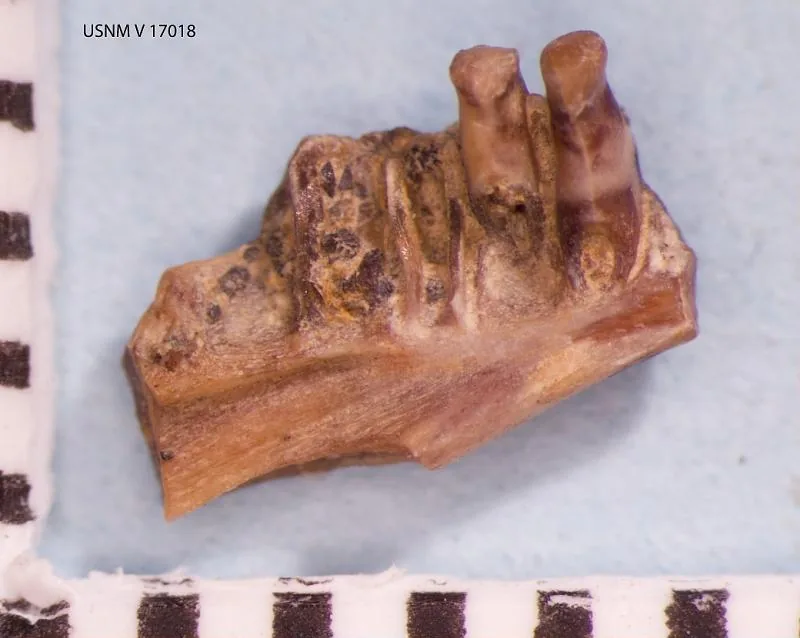
Habrosaurus dilatus Gilmore, 1928
V17018 · Mesozoic / Cretaceous / Late / Maastrichtian
Smithsonian Institution, National Museum of Natural History
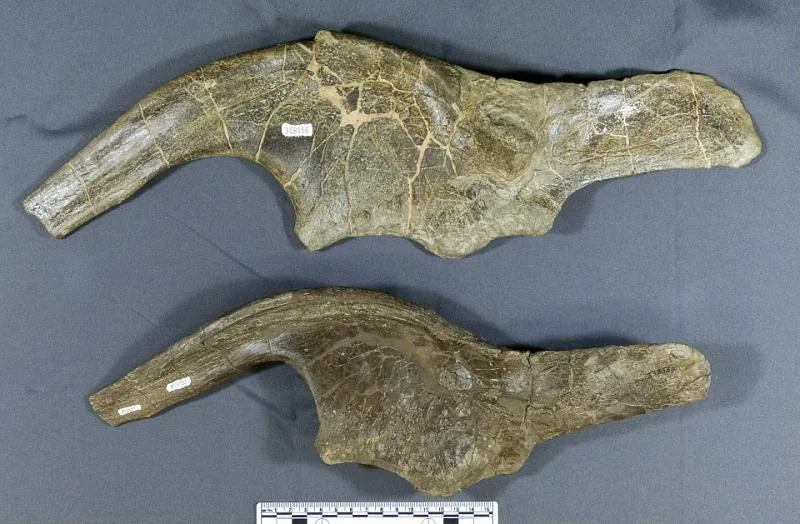
Kritosaurus sp
PAL358555 · Mesozoic / Cretaceous / Late / Campanian
Smithsonian Institution, National Museum of Natural History
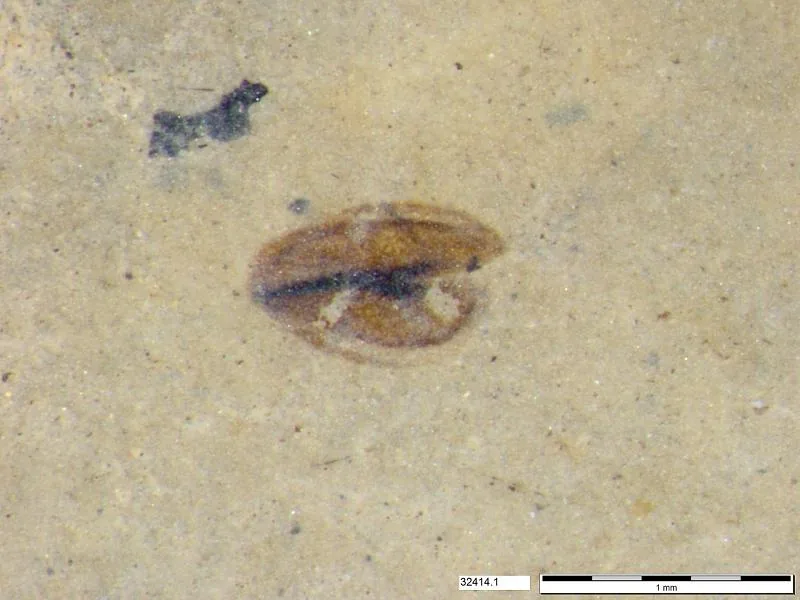
Tracheophyta
PAL722538 · Cenozoic / Paleogene / Eocene / Middle
Smithsonian Institution, National Museum of Natural History
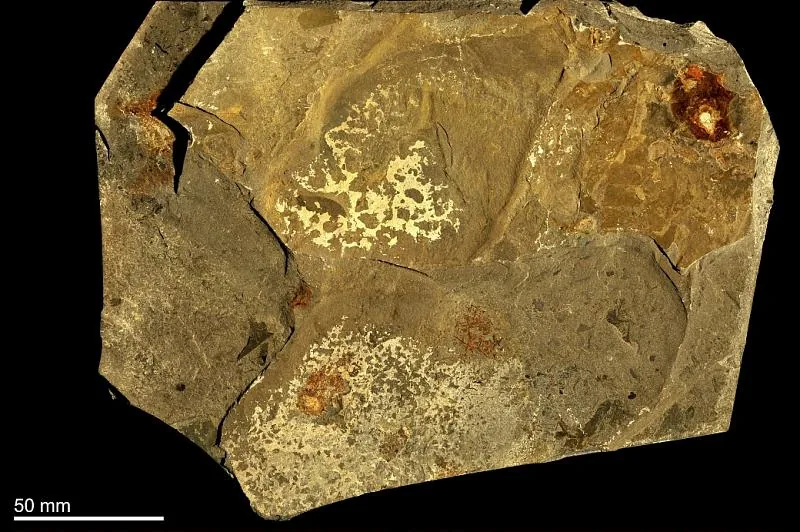
Anomalocaris canadensis Whiteaves, 1892
PAL213890 · Paleozoic / Cambrian / Middle
Smithsonian Institution, National Museum of Natural History
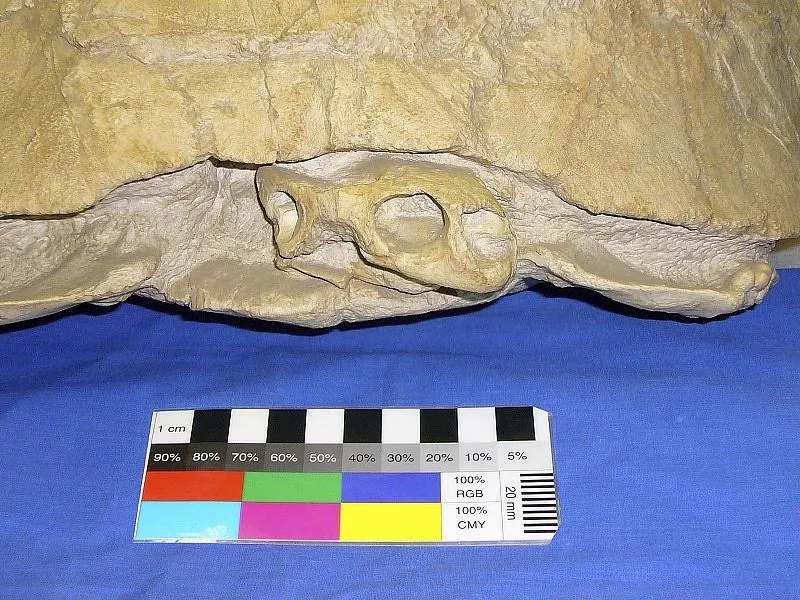
Stylemys nebrascensis Leidy, 1851
PAL358863 · Cenozoic / Paleogene / Oligocene
Smithsonian Institution, National Museum of Natural History
12 / 40 photos
Other Assets
Geist Font
Google Fonts (Vercel)
OFL 1.1
Noto Sans CJK Bold / Deep Time Share
Noto Project — modified font used in share images
OFL 1.1
O₂ literature ranges
Mills et al. (2023), Evolution of Atmospheric O₂ Through the Phanerozoic, Revisited, DOI 10.1146/annurev-earth-032320-095425
Original literature summary
생물군/계통수
Compiled from textbooks and literature
Editorially curated
Music & sound
Aurora — Scott Buckley · CC BY 4.0
Edited for looping playback with volume adjustment.
Impact sound: original sound design by Play Deep Time Earth.